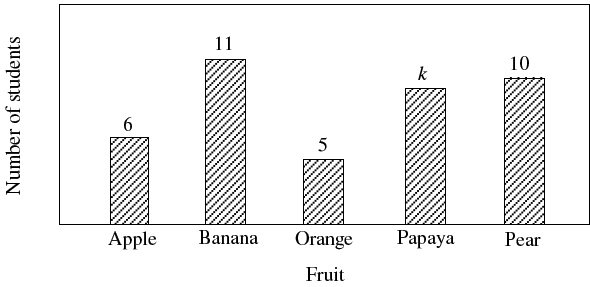
The bar chart below shows the distribution of the most favourite fruits of the students in a group. It is given that each student has only one most favourite fruit.
Distribution of the most favourite fruits of the students in the group
If a student is randomly selected from the group, then the probability that the most favourite fruit is apple is
203.