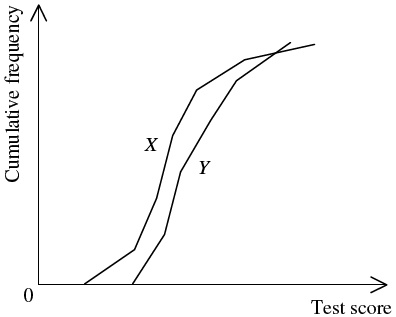
The figure below shows the cumulative frequency polygons of the test score distributions
X and
Y. Let
m1,
r1 and
s1 be the median, the range and the standard deviation of
X respectively while
m2,
r2 and
s2 be the median, the range and the standard deviation of
Y respectively. Which of the following are true?
I.
m1>m2II.
r1>r2III.
s1>s2