Q32 Exponential and logarithmic functions
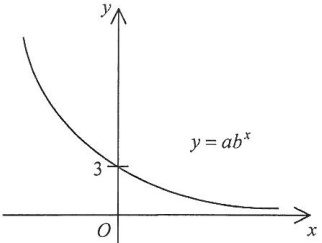
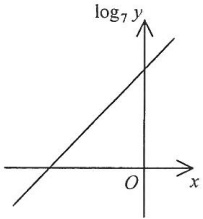
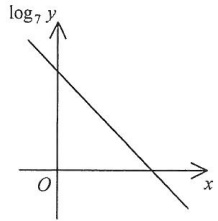
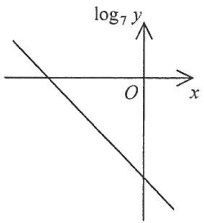
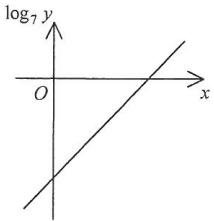
The figure above shows the graph of , where and are constants. Which of the following graphs may represent the relation between and ?
DSE Mathematics · Core
Sample · Practise · Paper 1 & Paper 2 · 2012–2024